When customer experiences contradict healthy metrics, C-suite leaders should investigate what their KPIs may be missing and verify that fixes improve actual customer outcomes.
A customer complaint that contradicts a healthy KPI belongs in our C-suite level business review cadence (WBRs, MBRs, and QBRs). Before accepting that the customer represents an isolated exception, we should expect the VPs and Directors who report to us to explain how that experience can coexist with the performance they are reporting. Understanding that discrepancy may reveal a problem our measurement system has not yet captured.
Jeff Bezos illustrated this in a 2023 interview with Lex Fridman, recalling an early Amazon business review where customer-service metrics suggested callers waited less than roughly a minute, despite complaints about longer waits. When he called the service number during the meeting, he remembered waiting more than ten minutes. His observation that “when the data and the anecdotes disagree, the anecdotes are usually right” came with an important qualification: the disagreement should lead executives to examine what the company is measuring. This mental model is one I continuously leaned in during my time as part of Amazon’s leadership team when auditing and inspecting my business unit’s performance.
For those of us leading businesses, that means maintaining enough familiarity with the customer experience to recognize when our reporting deserves closer scrutiny. Bezos made a related argument in his 2016 shareholder letter, warning that surveys and processes could become substitutes for understanding customers. We should expect a VP who can explain movements in a dashboard to also explain what customers experience when using the product and where that experience begins to undermine their confidence.
Consider a SaaS company reporting faster support resolution while customers complain that their problems remain unresolved. If the support team closes tickets after sending instructions, the reported improvement may reflect how quickly employees respond rather than whether customers can complete their work. Asking the responsible Director to reconstruct a recent case, from the customer's first attempt through the eventual outcome, gives leadership a way to examine that difference through the actual exchange and the customer's ability to finish the task.
Understanding the discrepancy also requires examining how the KPI is constructed, including when measurement begins and ends, which customers enter the calculation, and what qualifies as success. Onboarding time can appear to improve when the calculation excludes customers who abandon implementation, just as a revenue-weighted satisfaction score can conceal worsening experiences among smaller accounts. Comparing the same customer groups over time helps establish whether the service is improving or whether a change in the customer mix is making the results look healthier.
Once those measures reflect the customer's experience, the discussion should move toward the inputs your team can control. Bezos described this approach in his 2009 shareholder letter, explaining Amazon's emphasis on controllable inputs as the means of improving financial results. For a team investigating onboarding abandonment, that might mean measuring how often access permissions and data connections are validated before implementation begins, then testing whether better preparation reduces delays and improves completion. The value of that input KPI depends on whether changing it helps the team deliver a better customer outcome.
Pressure-testing our VPs and Directors requires them to connect those measures to firsthand observations and explain the reasoning behind their conclusions. A leader should understand what the customer was trying to accomplish, where the process failed, and whether similar cases suggest a broader problem. Asking what evidence would change that explanation helps keep the investigation open, because a single complaint can identify a failure worth reproducing without establishing how frequently it occurs across the customer base.
Wells Fargo's 2017 independent-director investigation demonstrates how consequential the failure to examine those signals can become. The report found that its former CEO relied on positive customer and employee surveys while responding too slowly to improper sales practices, even as complaints reached him and were referred onward without further follow-up. When he learned that roughly 1% of Community Bank employees were being terminated annually for sales-integrity violations, he took reassurance from the implied 99% doing their jobs correctly. For C-suite leaders, the lesson is to examine the harm within an exception before allowing a favorable percentage to settle the discussion, particularly when a credible report of serious harm warrants containment while the team investigates its scope.
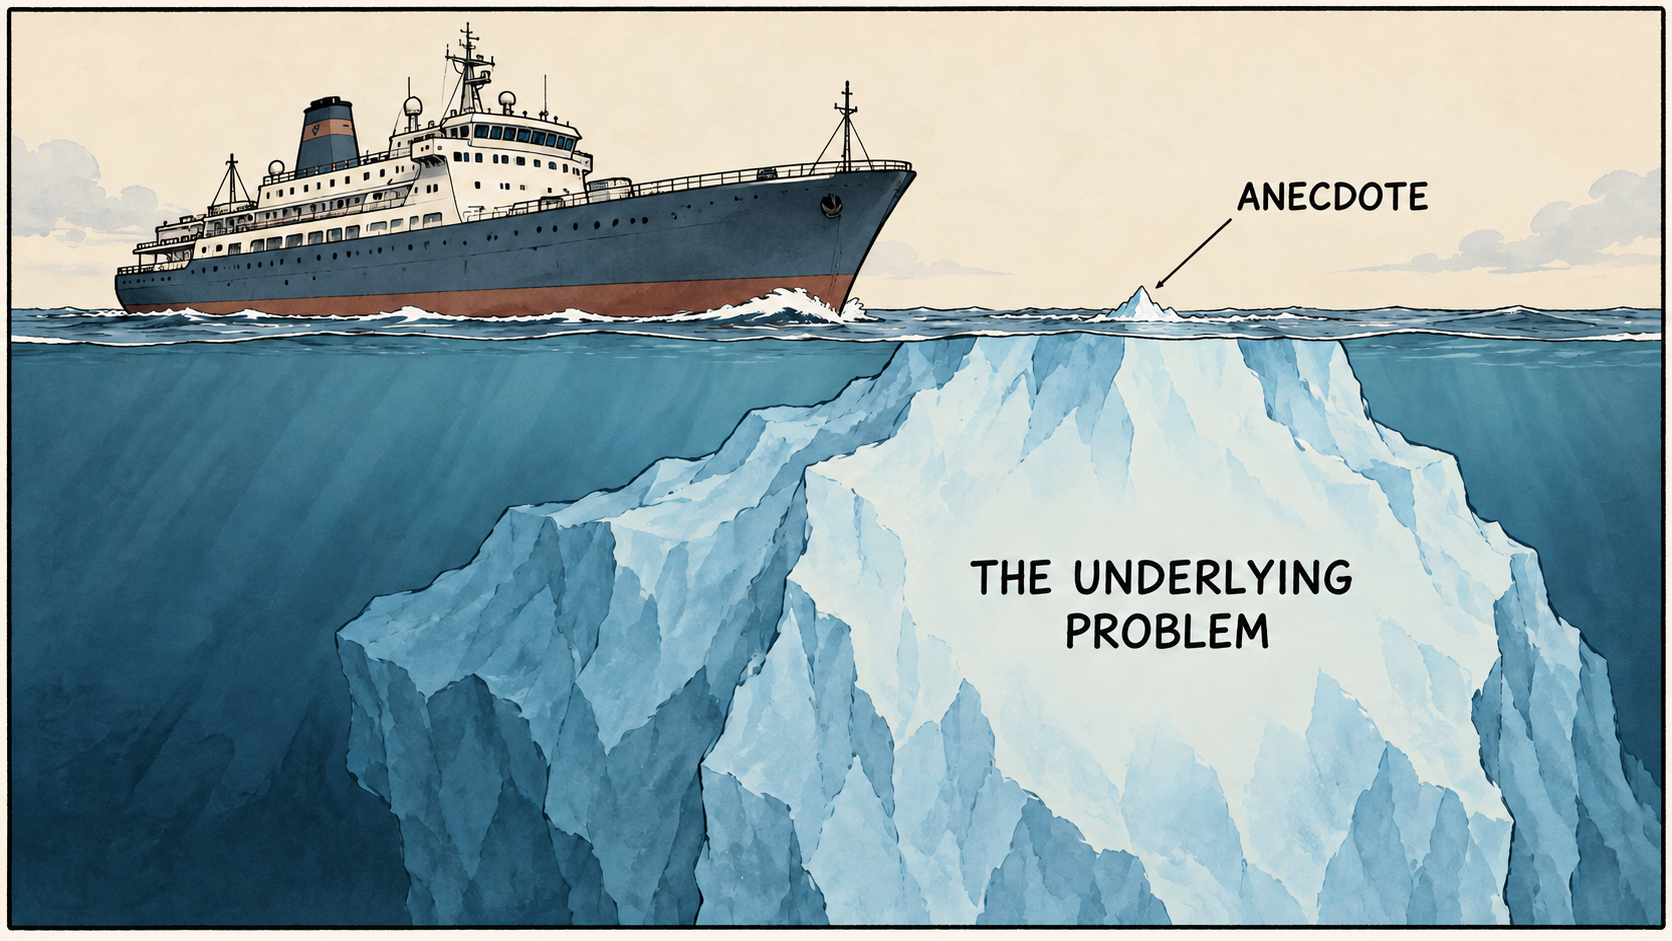
That attention to exceptions should also influence product decisions. I am of the opinion that studying the customers having the hardest time getting value can teach us more about a product's weaknesses than repeatedly optimizing an already acceptable median experience. The least active customers and smallest accounts deserve attention, especially when their problems rarely reach senior leadership, although understanding why they struggle must come before deciding what to build. Low usage may reflect friction or simply infrequent need, while low revenue may reflect company size.
For time-based measures, examining the median, or p50, alongside p90 and the experiences beyond it helps make those differences visible. If p90 onboarding time is three weeks, approximately 10% of completed implementations take longer still, with customers who never finish requiring separate attention. Google's site reliability guidance explains why averages can conceal substantial changes in the slowest experiences and recommends examining the distribution. Those difficult cases can help your team identify obstacles that typical customers also encounter, even if their resources or experience allow them to work around the problem.
There is a useful mathematical principle behind this approach: for the same measure, customer population, and measurement period, meeting a time target at p90 means the median meets that target too. Improving p90 does not necessarily improve p50, however, and fulfilling one small customer's feature request does not automatically benefit everyone else. Broader improvement comes from removing shared obstacles, such as an approval process that overwhelms a small team while creating unnecessary coordination for larger customers. Microsoft's inclusive-design guidance illustrates a similar principle through captions, which help both people with hearing impairments and people consuming content in noisy environments.
To make this part of the operating cadence, customer experiences that challenge headline results need an accountable owner and a place in subsequent reviews. The initial discussion should establish which customers may be affected, what input the team proposes to change, and what evidence would demonstrate improvement. Following up with the original customers after the fix, while checking results across the broader population, allows leadership to determine whether the problem has been resolved and whether the learning applies elsewhere.
Our response in those reviews will influence whether leaders continue bringing us information that challenges their own reporting. We should hold our VPs and Directors accountable for investigating contradictions while giving them room to acknowledge what they do not yet understand. When a leader arrives with a healthy dashboard and a customer story they cannot explain, making time to investigate that story may give us an opportunity to address a serious problem before it becomes visible in the company's financial results.